Welcome to the Extended PDZ Database
Motivation
A central paradigm within structural biology is the concept of domains.
In past definitions, domains would be linked to units of compact structure,
evolution and folding, and/or function. With the advent of modern bioinformatics,
the conservation of domains throughout evolution became instantly recognisable,
leading to the established view that domains can be represented by a specific
sequence of secondary structure elements that adopt a canonical form when in solution.
Much less appreciated but still important is that a significant number of domains have
additional elements of structure that lie almost immediately before or after the canonical domain,
extending the domain. The presence of these extensions and their impact on folding,
structure, dynamics, and function of the domain to which it is attached is of particular
significance for the PDZ domain (which was named after the three proteins - PSD95, DLG1, and ZO1 -
that led to its discovery).

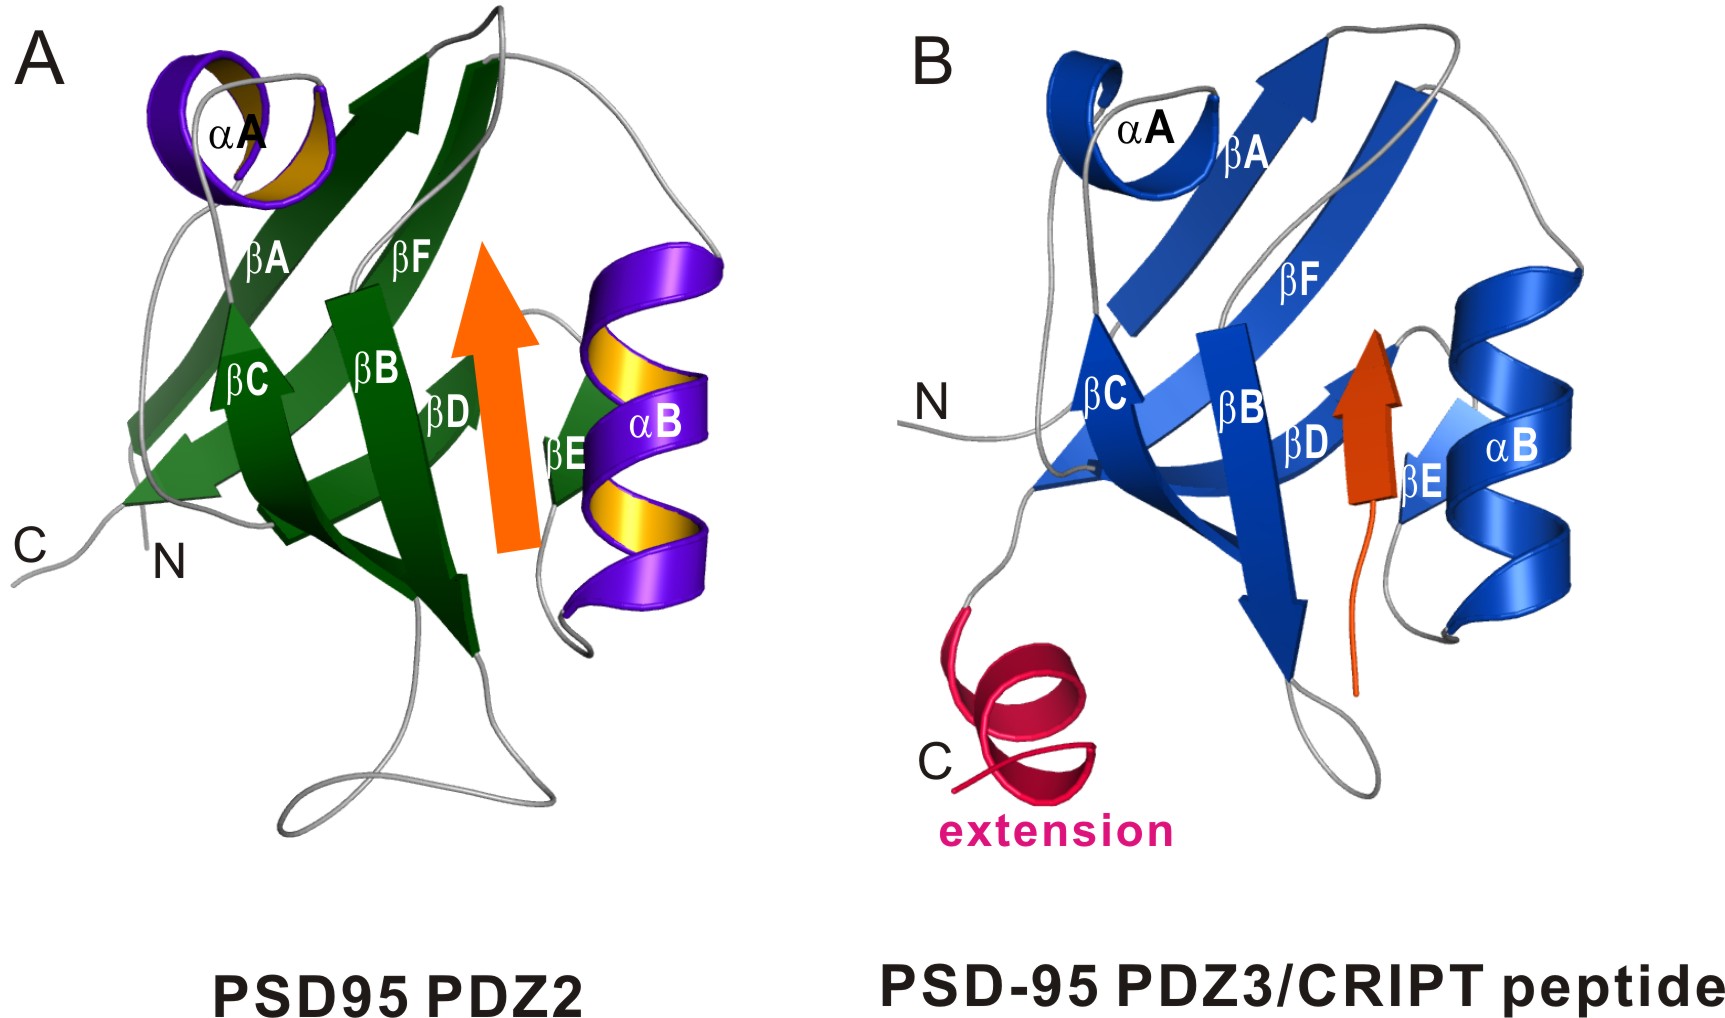
Figure 1: Canonical and extended PDZ structures. Panel A shows a ribbon representation
of the structure of PSD-95 PDZ2. The canonical fold contains six β-sheets and two
α-helices. A peptide ligand (orange) is shown bound to the PDZ. Panel B shows a
ribbon representation of the structure of PSD-95 PDZ3, which is an example of an extended
PDZ domain. Notice the additional helix (pink) at the C-terminal end of the canonical PDZ
domain.
Materials and Methods
We searched for extended PDZ domains using bioinformatics, using the definition that extensions
are structured regions outside the canonical PDZ domain boundary. To perform this search, we
initially needed sequences and domain boundary information for PDZ-containing proteins.
We also needed methods of predicting structure from sequence; we used several programs
to predict secondary structure and to
predict disorder. All predictions have been collated into this database, which uses PHP to
display the results and MySQL to store the data.
Figure 2 illustrates the overall procedure used to generate the predictions, highlighting five main steps:
- Select Database,
- Extract Sequence and Domain Boundaries,
- Define Input Sequence,
- Run Prediction, and
- Analyse Result.
Figure 2 also shows a specific application of the procedure.
We will describe in more detail each step of the procedure below.

Figure 2: Flowchart of the process used to search for structured PDZ extensions.
The general procedure is shown on the left, and a more specific example, which uses only
the C-terminal extension region as input for prediction by the program PSIPRED, is shown
on the left.
Select Database
We chose UniProt, a source of curated protein entries,
as the source of our protein
sequences and domain boundary definitions. We extracted sequences that contained at
least one PDZ domain and were complete (i.e. not a fragment) and reviewed because the
quality of the annotation was important for this study.
From UniProt, we obtained 154
human and 128 mouse sequences that satisfied our search criteria. (We did not look at
other species in detail because our search criteria gave us very few results; e.g. 12
from zebrafish, and 13 from fruitfly.)
Extract Sequence and Domain Boundaries
Each reviewed protein entry in UniProt
contains sequence annotation information, such
as the start and end position of any constituent domains. We used these annotations to
define the location of the PDZ domains (and other domain types) in protein sequences we
extracted. The canonical PDZ domain contains six β-sheets and two α-helices; often, domain
boundary definitions in other databases, such as SMART,
ignores the first β-sheet, causing
the predictions for the N-terminal extension region to be biased. We believe that the curated
entries of UniProt would provide the most accurate domain boundary definitions compared to
other available databases.
Define Input Sequence
All prediction programs require an input sequence. The results from these prediction
programs can be sensitive to the composition of the input sequence. Therefore, we decided
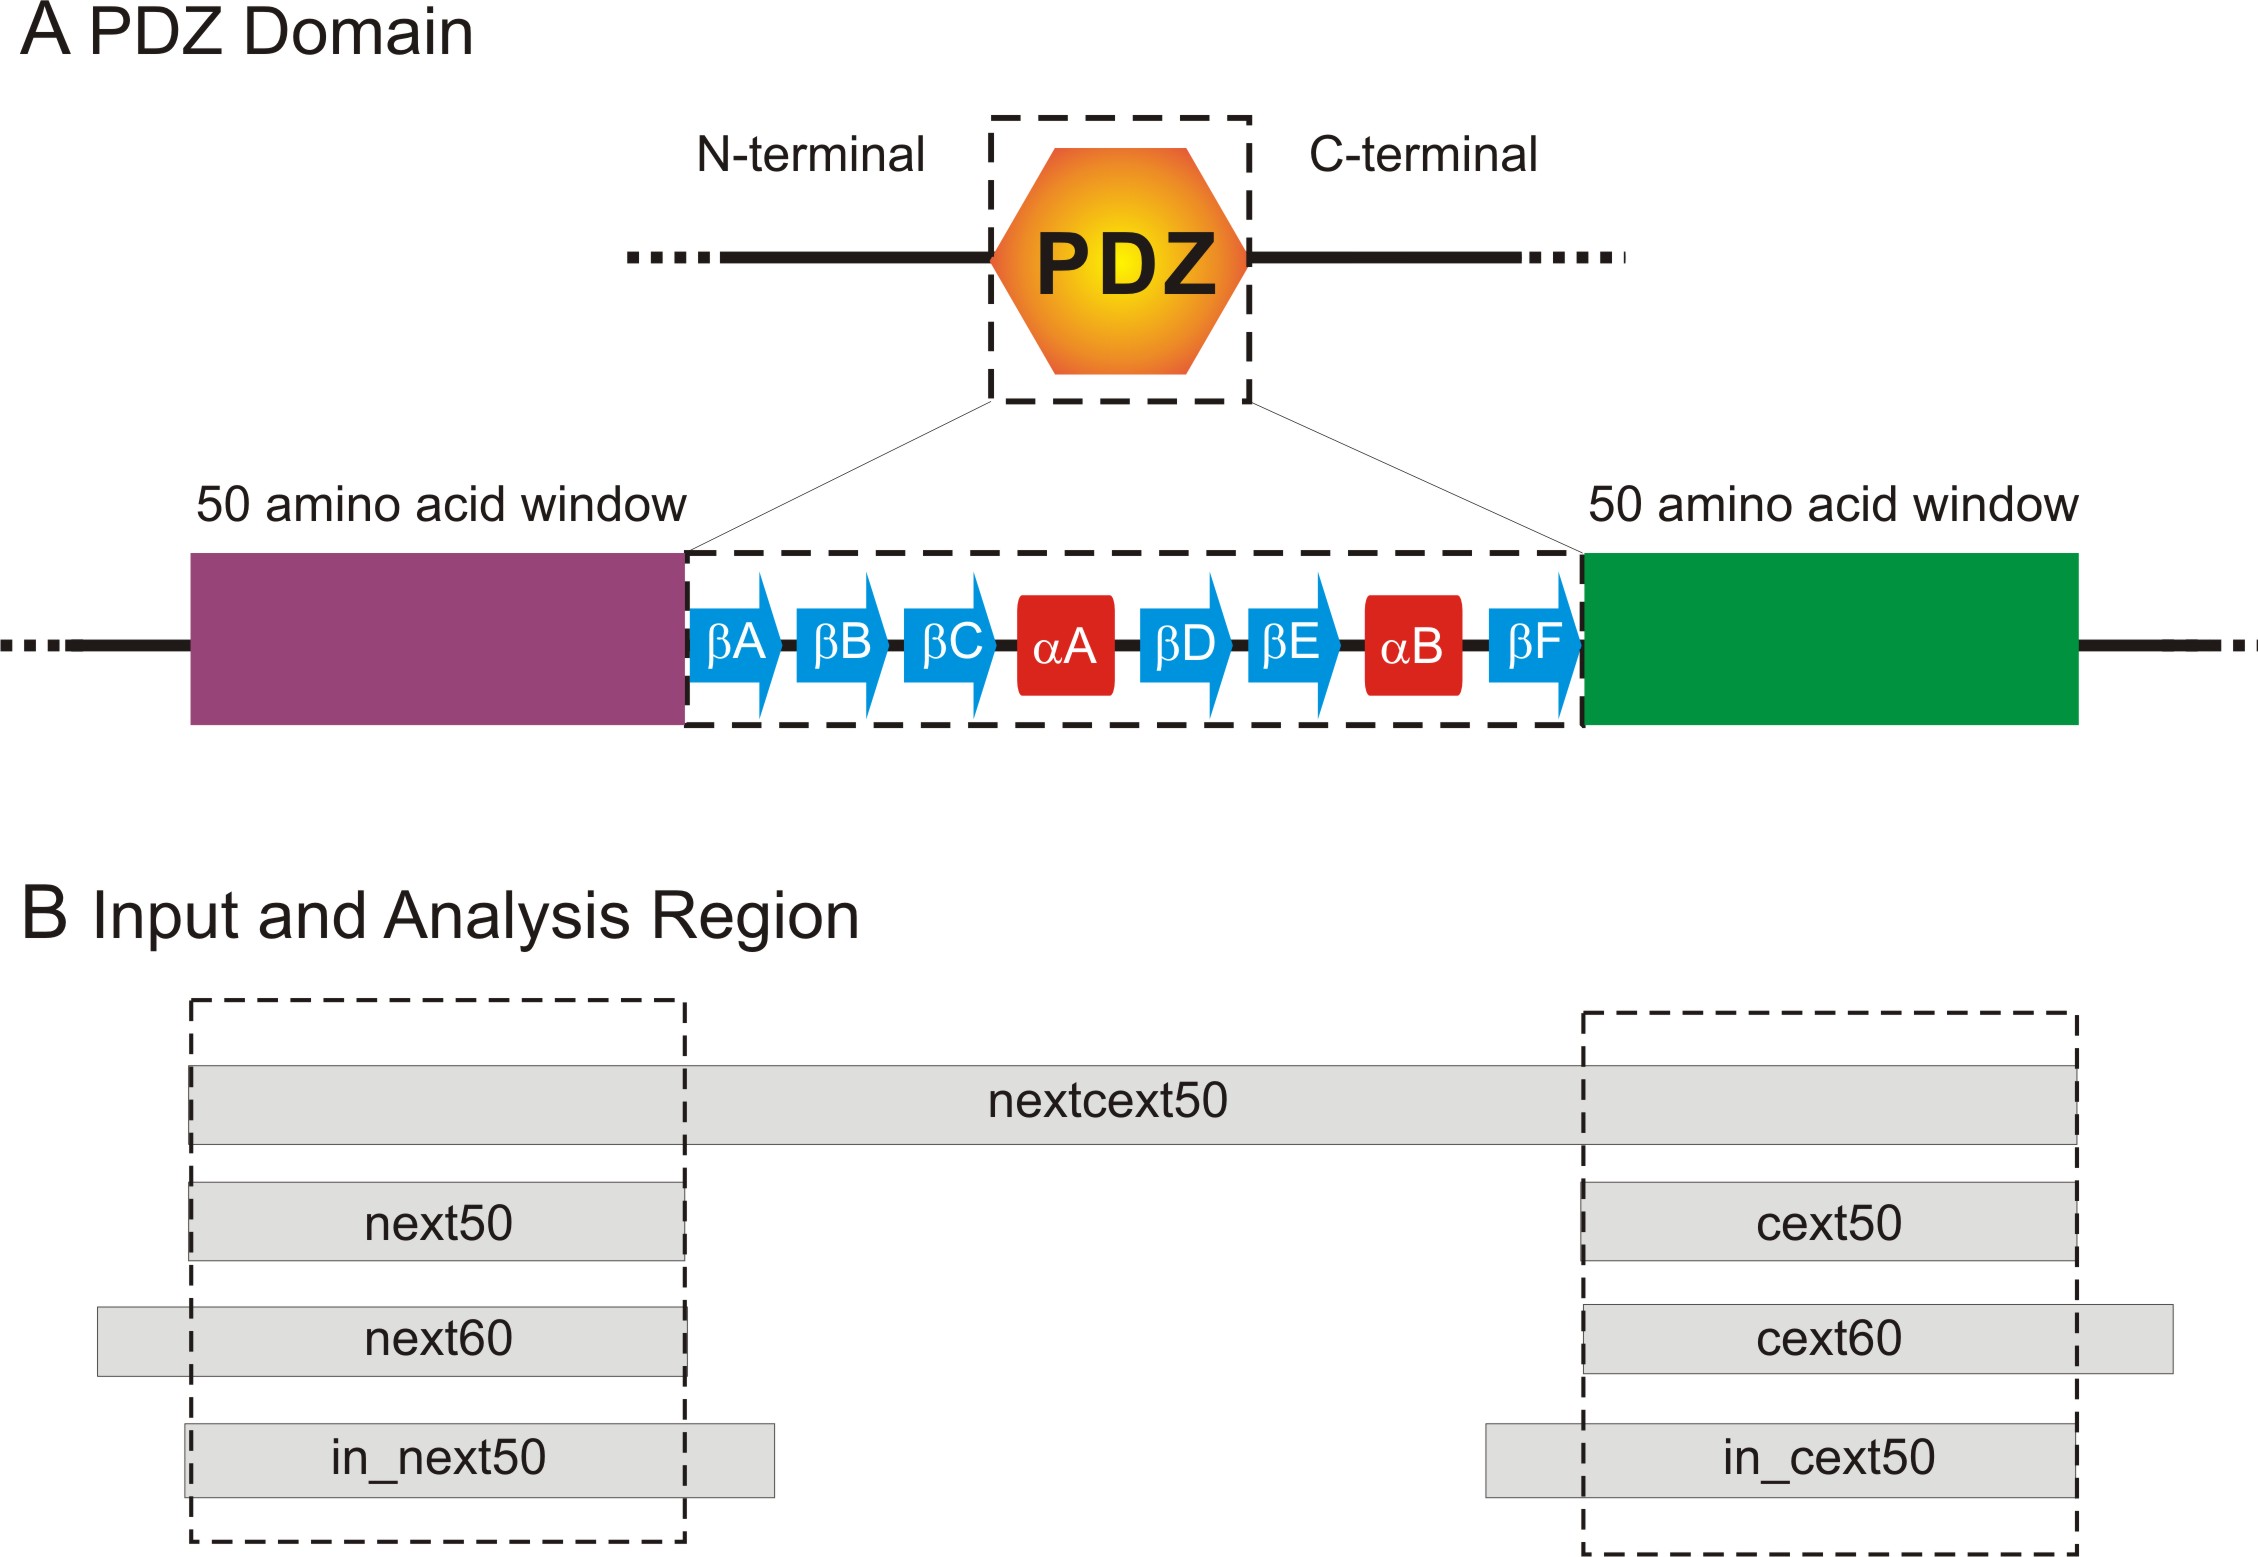
to use different input sequences to give us an idea of how the predictions varied. Figure 3,
panel B in particular, shows the different input sequences that were used for the predictions.
Each input sequence contained at least a 50 amino acid long extension sequence (extending
either the N- or C-terminus of the PDZ domain), but differed by their start or end position.

Figure 3: Input Sequences for Predictions.
Panel A shows the overall region that was analysed. We focused on sequence regions that are
50 amino acid residues in length on either side of the PDZ domain. The canonical secondary
structure content of a PDZ domain is also illustrated.
Panel B shows the different input boundaries used for predictions. The dotted box highlights
the regions used for analysis of the prediction results.
Run Prediction
We were interested in looking for structured regions in the input sequences. To do this, we
used the programs PSIPRED,
PROFPHD, and
PREDATOR to predict secondary structure and
DISEMBL
and
DISOPRED
to predict disorder. We used the default parameters for each program.
Analyse Result
After the predictions were made, we applied several metrics to analyse the 50 amino acid
extension region on both ends of the PDZ domain. Details of each prediction can be viewed
by clicking on the appropriate entry. We summarized the predictions in several plots and
they can be viewed in more detail by clicking the statistics links on the left side menu.


